ColorTools: Tools for spectral analysis
LabVIEW Toolkit or ColorCreator standalone installer
- Compose spectra from included and custom components
- Analyze using all prominent color metrics and standards:
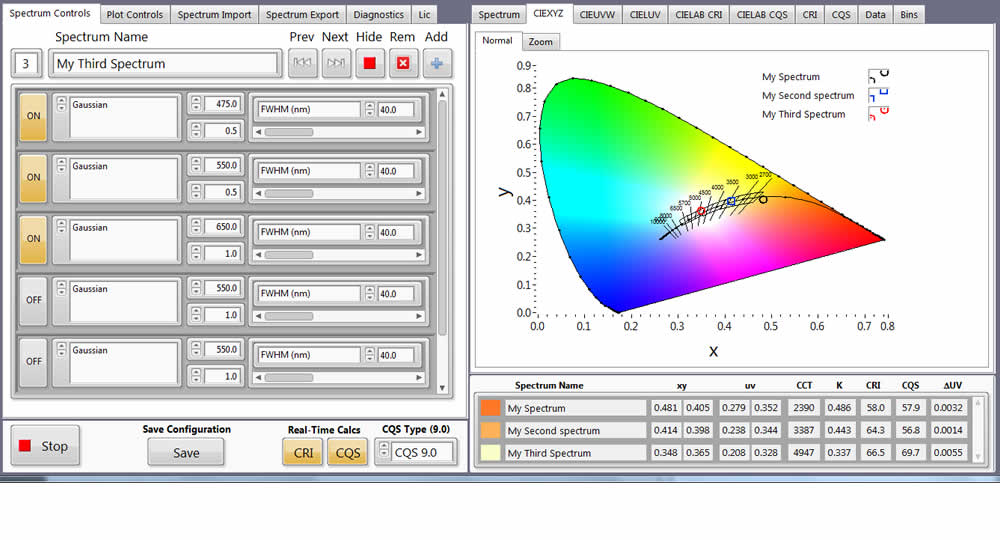
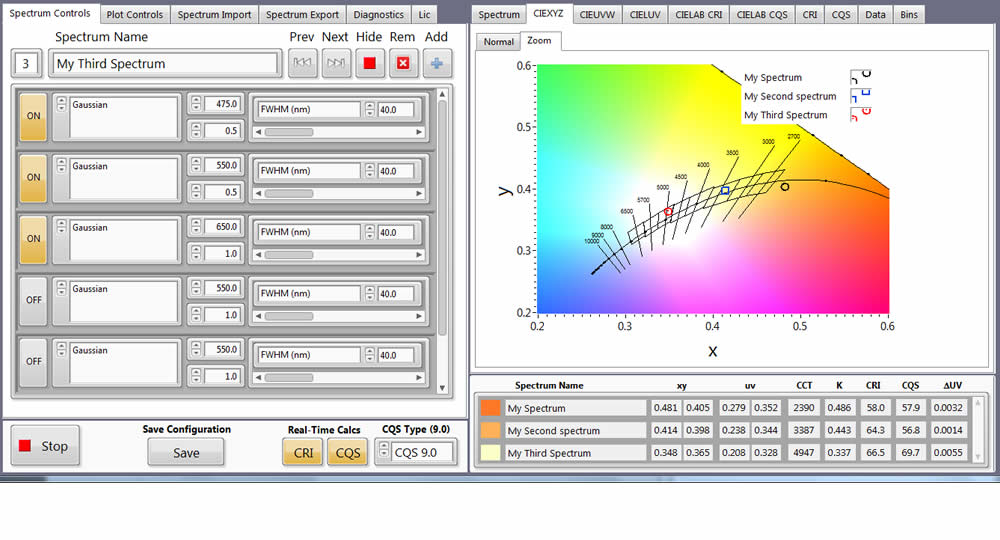
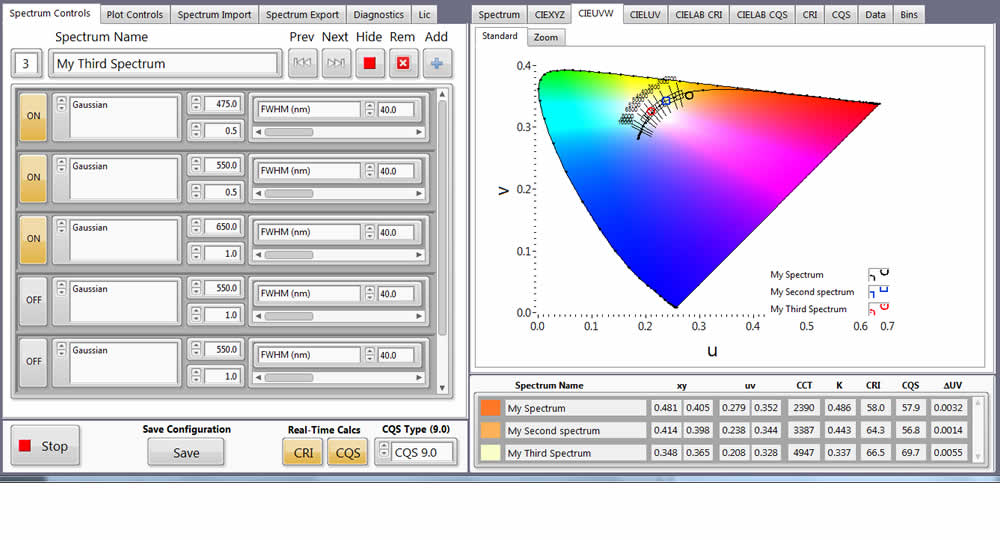
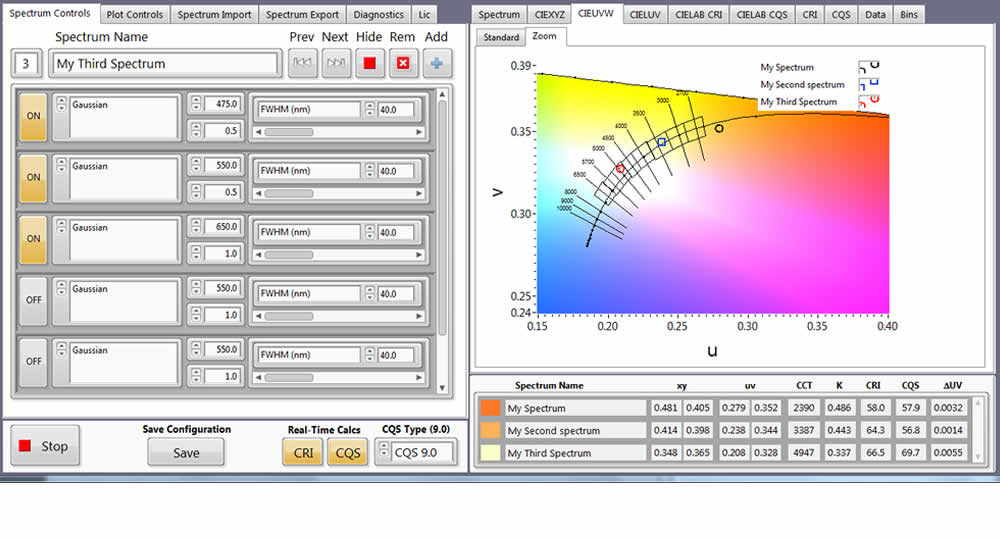
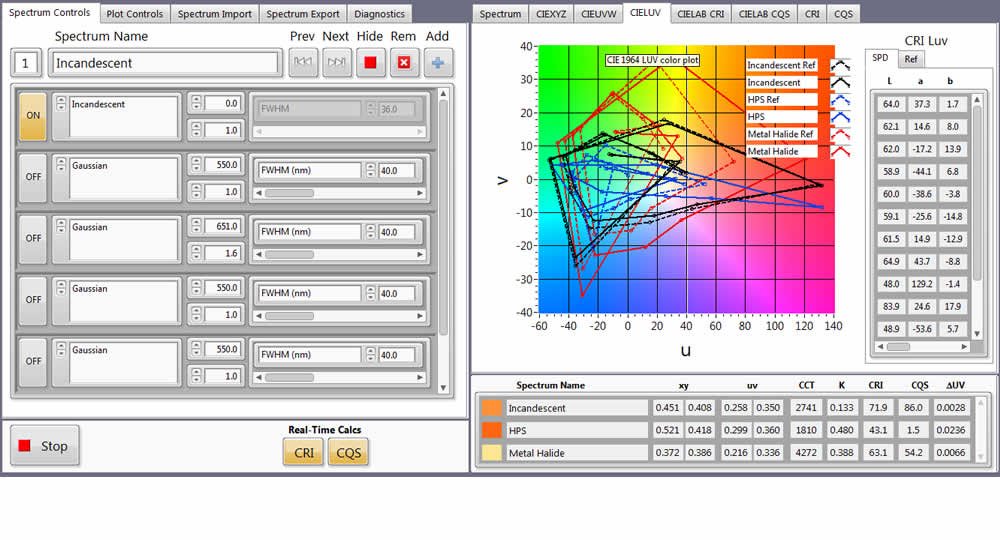
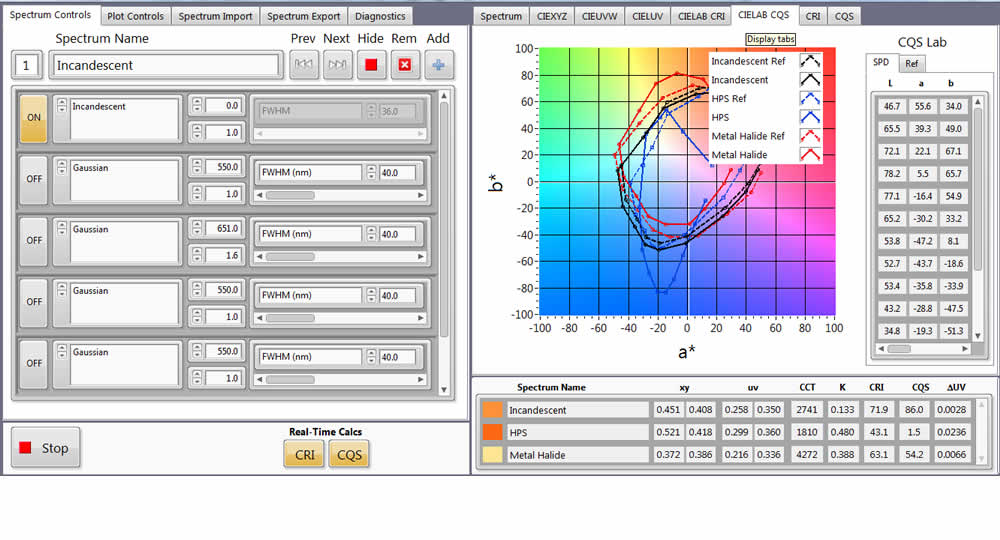
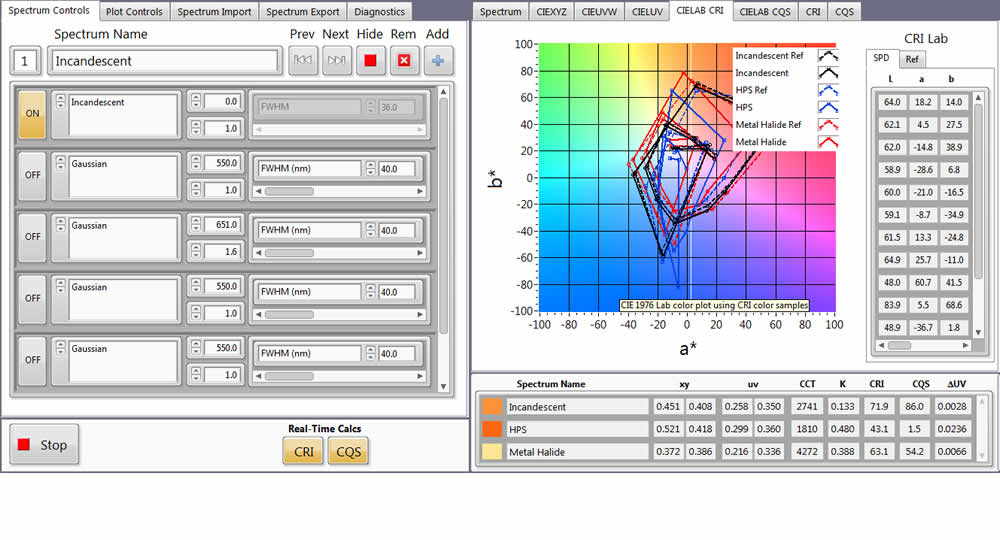
- CIE 1931 (xy), 1960 (uv), 1976 (Luv, Lab)
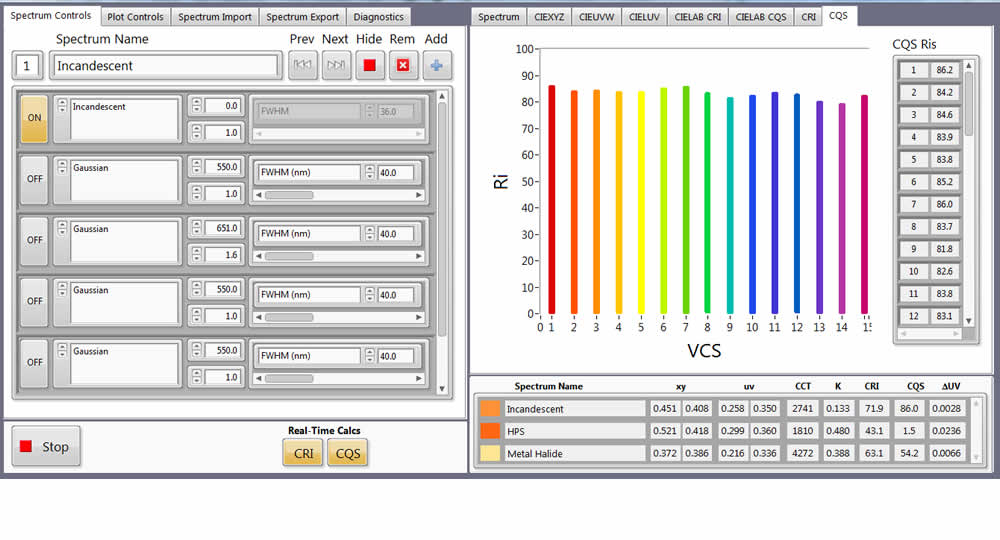
- Color Rendering Index (CRI), Color Quality Scale (CQS)
- ANSI C78.377 bins, custom bins, test for inclusion
- Use the LabVIEW toolkit to build applications with color analysis
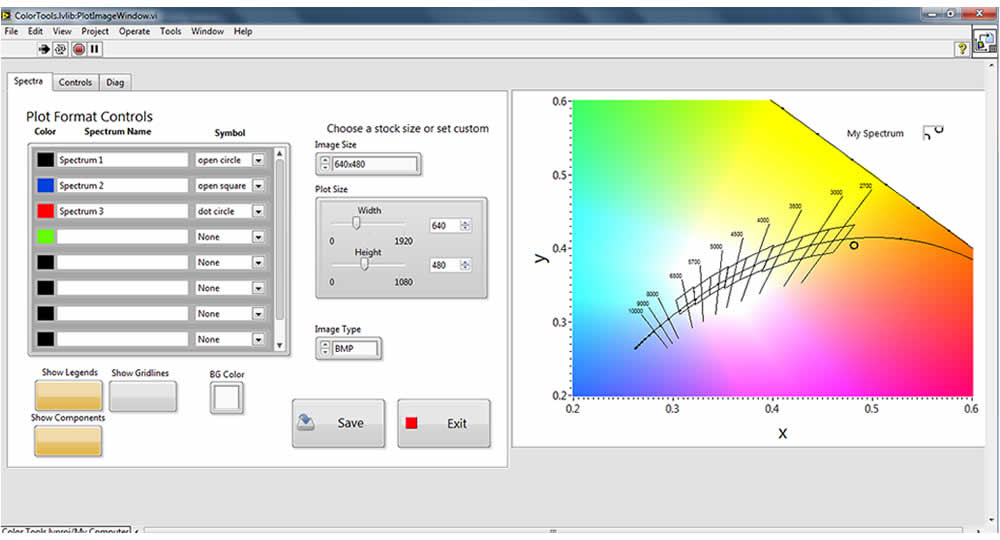
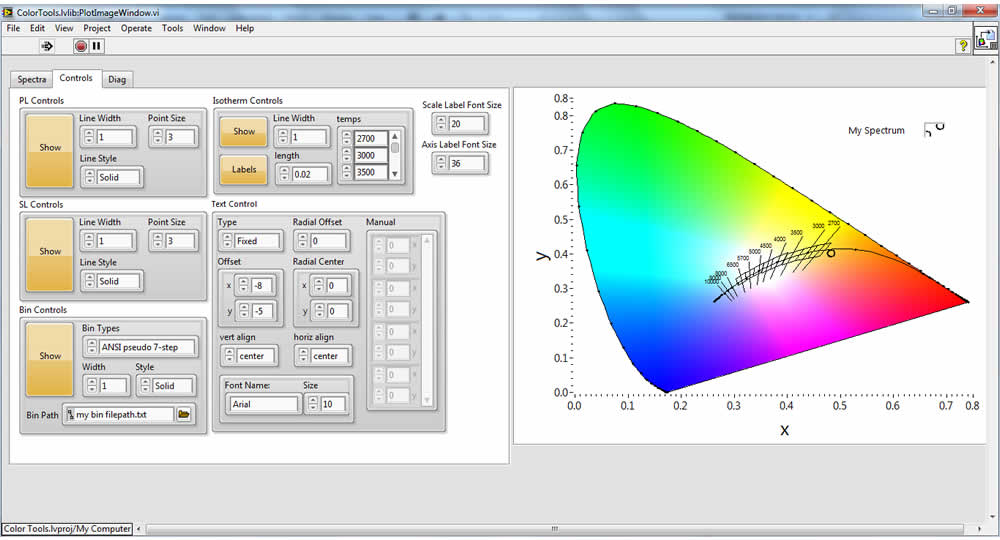
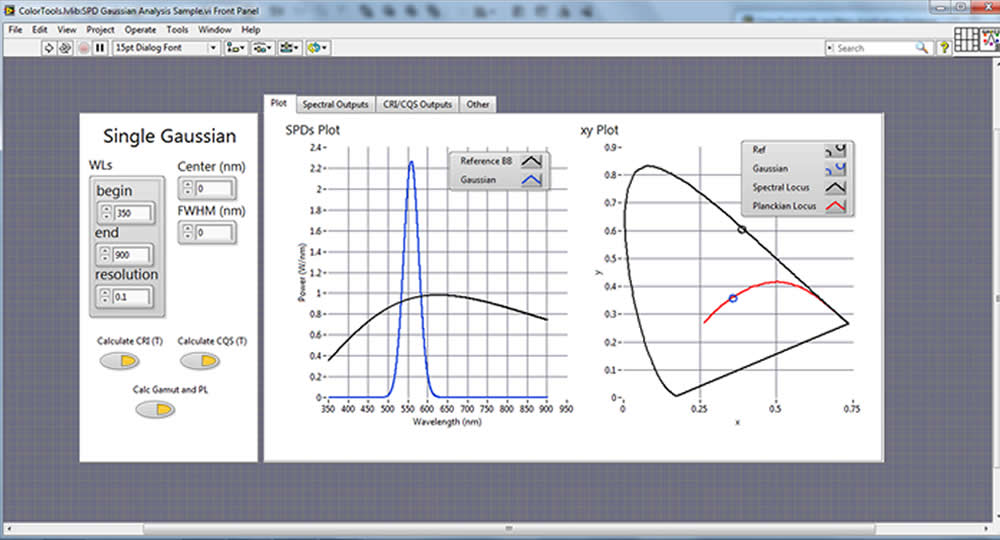
- Create and export professional quality xy (CIEXYZ), uv (CIEUVW), CRI, CQS, SPD plots and many more
- Create color fill, spectral locus (color gamut) and Planckian locus and isotherm plots
- Test inclusion in ANSI and custom bins, macadam ellipses
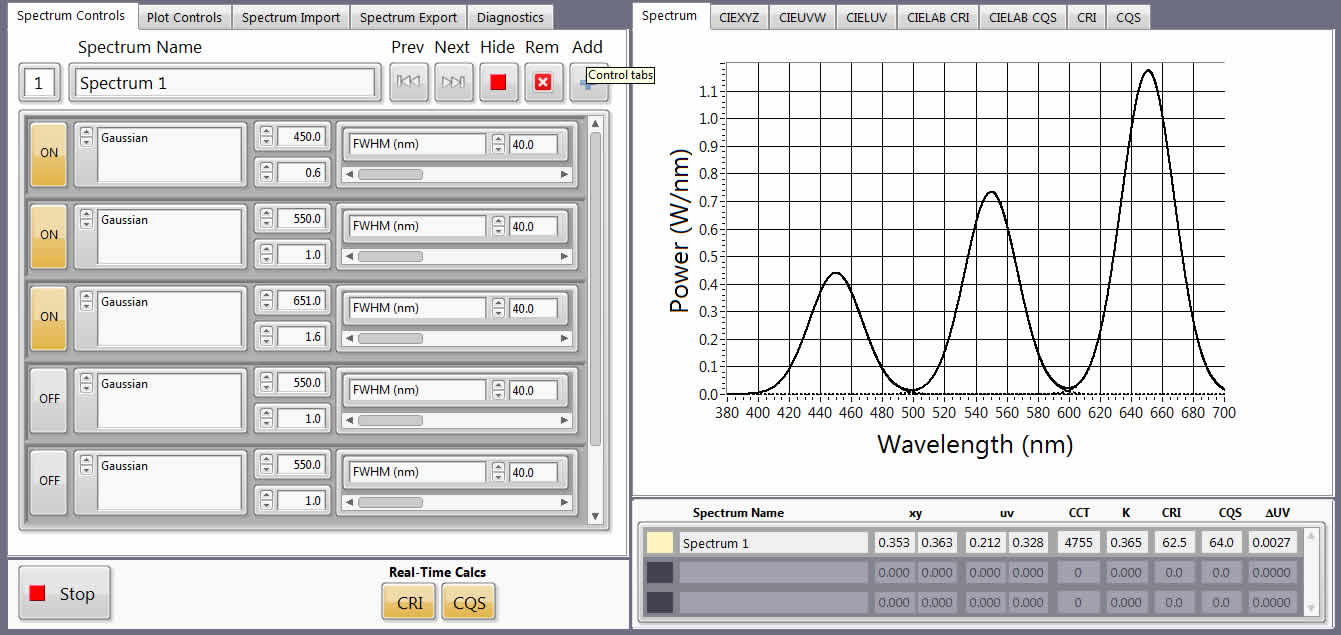
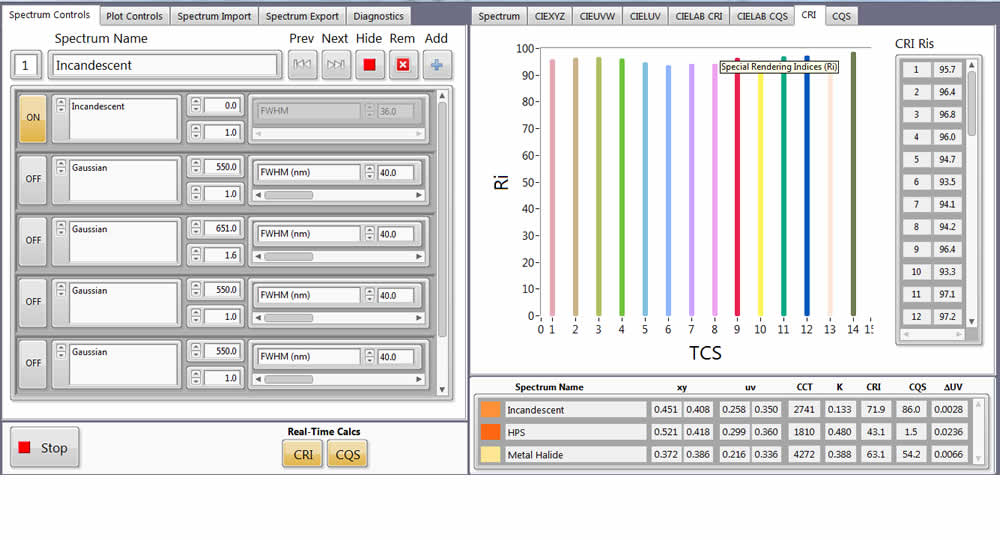
ColorCreator: Construct and analyze visible spectra from a library of light sources and waveformss
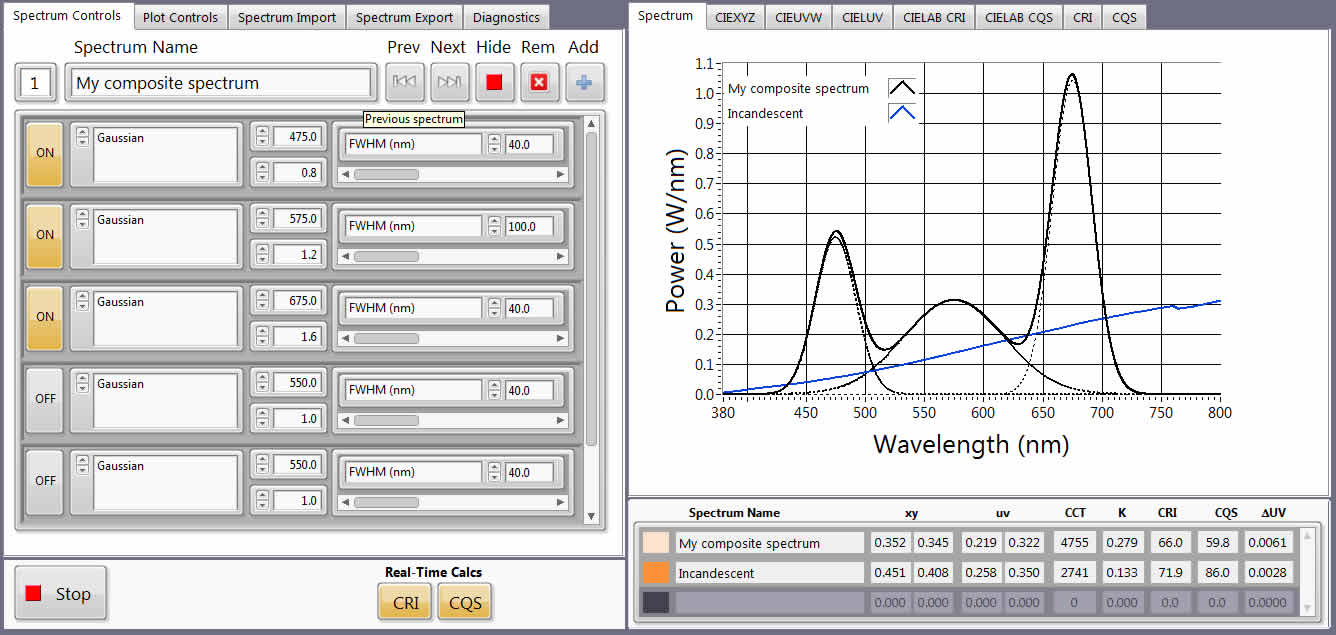
Shift, scale, and add included library components:
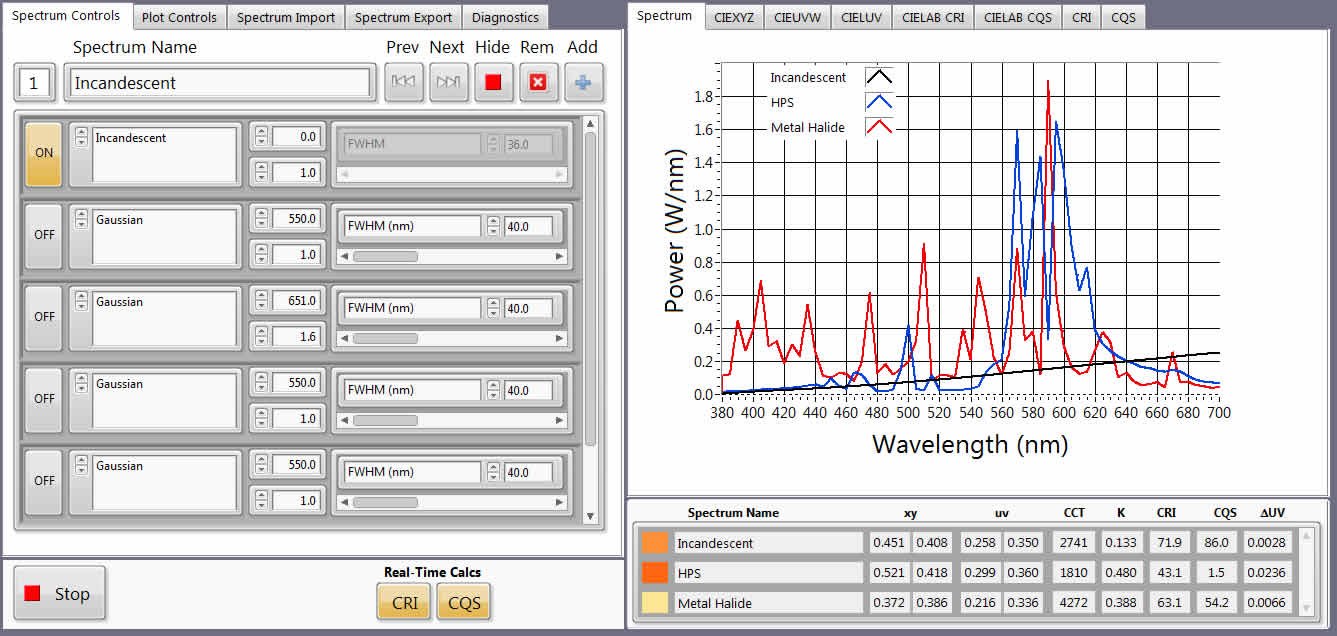
- Commercial products' spectra
- Standard Illuminants
- Theoretical sources
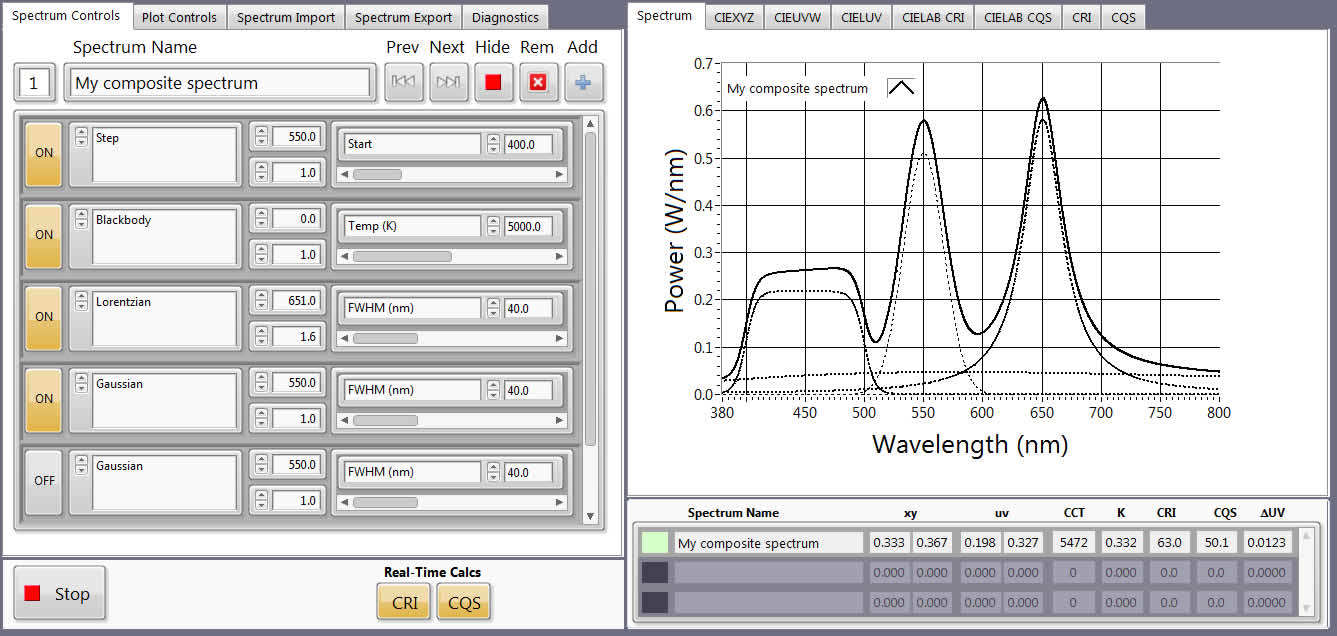
- Step, gaussian, blackbody, other waveforms
Import spectra and waveforms to your custom library; save composite spectra for later use
Measure and/or create spectra and import them into your own custom library. Perform analyses and save your results for later! Build spectra as complex as you like and don't worry about having to redo your work. Best of all, export your results in many easy-to-use formats.
Calculate color and rendering of imported and custom-built spectra; export custom plots
Color Calcs Gallery
Accurately calculate all key photometric quantities according to CIE standard calculation techniques:
- CIE 1931 (xy)
- CIE 1960 (uv)
- CIE 1976 Luv and Lab
- Color Rendering Index (CRI)
- Color Quality Scale (CQS)
- Luminous Efficacy of Radiation
- Lumens and total Spectral Power (for inline spectral analysi vis)
- Test for inclusion in ANSI and custom bins
Export custom high-resolution plots for publication and documentation
ColorCreator's export window allows you to export xy, uv, SPD, and many other plots to multiple file formats (jpg, bmp, png) in adjustable size. All plot options, such as legend, Planckian and Spectral loci, bins, and many more are adjustable for custom plots for publication. Best of all, these features are all available in the LabVIEW toolkit, with examples to help you auto-generate plots with your data acquisition.
Perform powerful analyses for standard and custom bin and ellipse inclusion
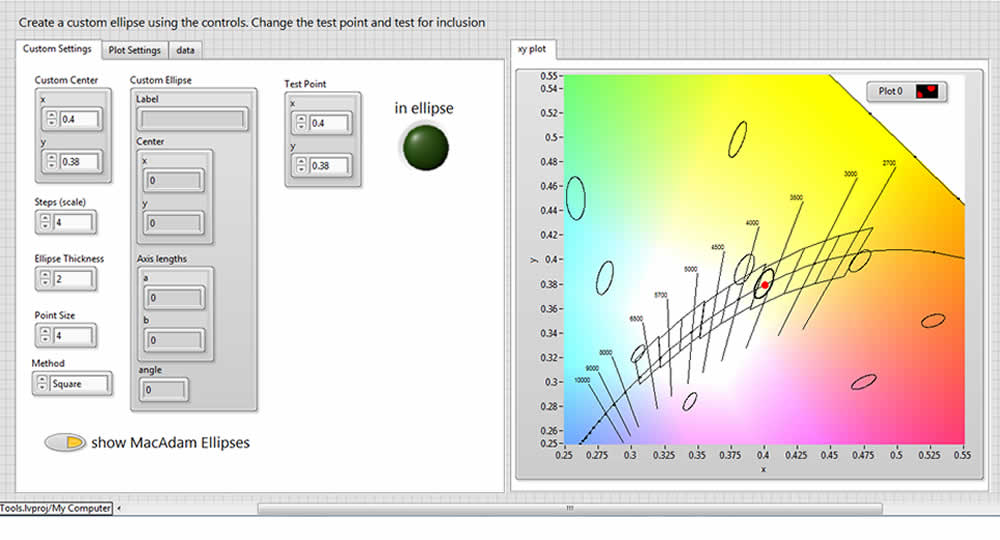
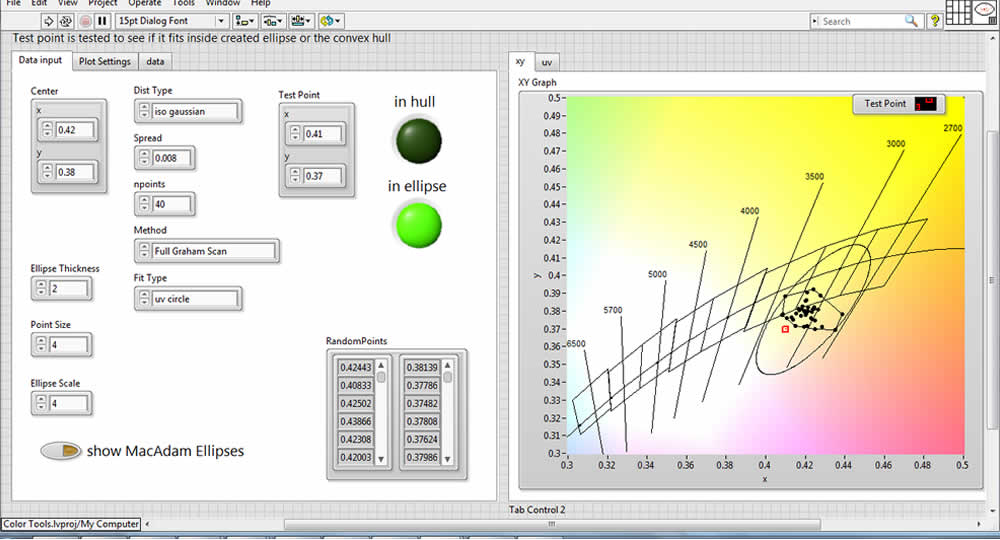
Bin and group your data based on color coordinates in xy and uv space
- Construct smallest convex polygon to include data
- Test inclusion in arbitrary polygons and ellipses
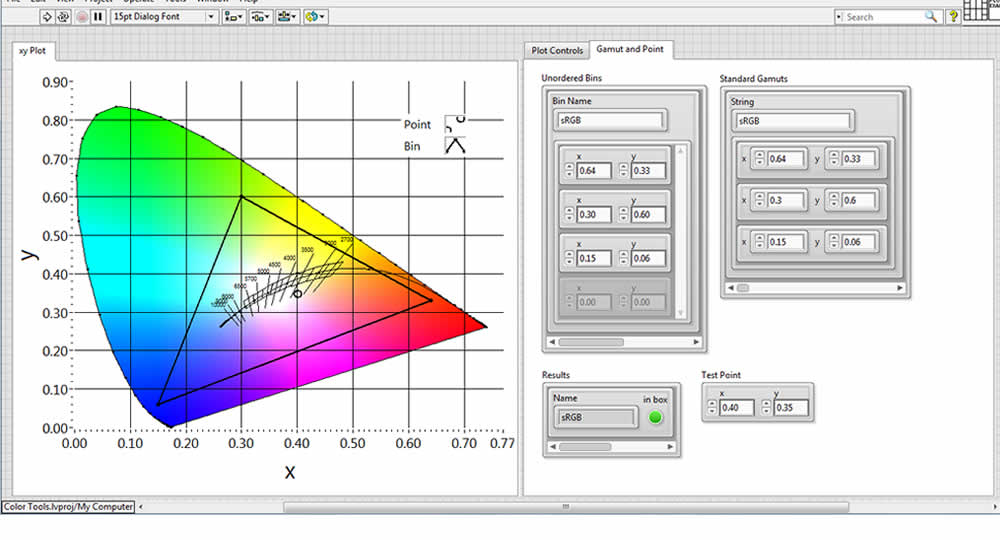
- Test color gamut inclusion (standard gamuts sRGB, NTSC, PAL, many more included)
- Construct custom and MacAdam Ellpses
- Test for inclusion in standard ANSI and custom bins
- Examples included for typical analysis applications
LabVIEW Toolkit: Build applications and integrated inline/realtime color analysis capability using color conversion and calculation libraries
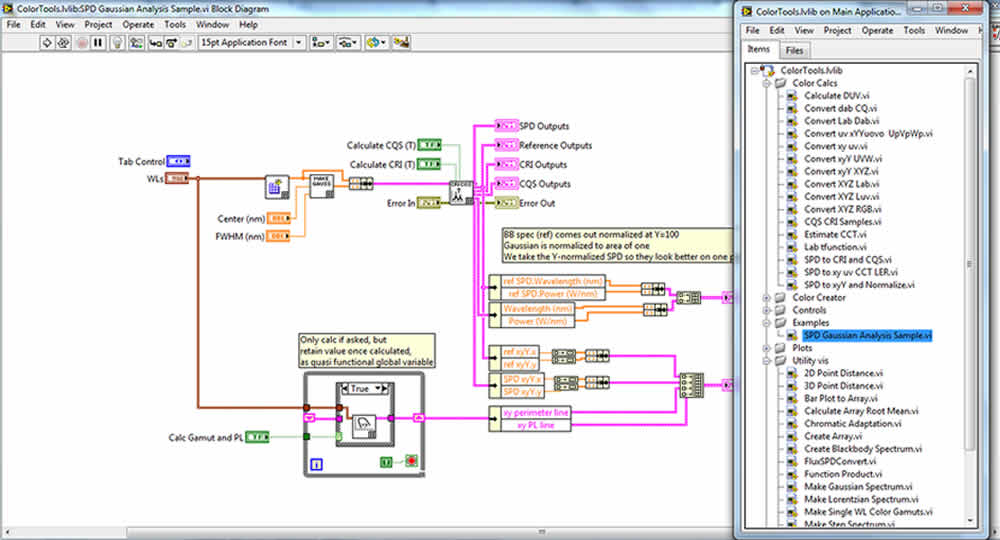
LabVIEW vis and examples help you to build color analysis software and analysis capabilities into your acquisition systems:
- LED Characterization tools: integrating spheres, goniometers
- Absorption/emission shift and color characterization
- Real-time multi-LED balancing to maintain color and rendering
- Any system where luminous efficacy or color quality needs to me measured and recorded in real time
ColorTools has been successfully integrated into inline analysis systems for real-time bin and sort applications. It has the speed, accuracy, and ease of integration necessary for industrial manufacturing and quality control. Please contact us for help on how we fit into your manufacturing and high-volume applications.